The Client Lifetime Value (LTV) Report helps you understand what each client is worth to your business in the long run. By looking at how much they spend and how often they visit, the report projects their total value over their entire " lifespan" as a customer.
Thing to know:
- Access to this report is controlled by the "Accessing Reports" access control setting.
- The Lifetime Value (LTV) Report helps you identify what your clients are worth to your business over time. It provides a complete financial picture by combining each client's past historical spending with their projected future value. By including what a client has already spent, long-term, high-value clients are never undervalued just because a business happens to have a short average customer lifespan.
- Only clients with a saved profile are tracked. Walk-in transactions are not included in this report.
- The Lifetime Value column is sortable and defaults to showing your highest-value clients at the top.
- Family/Pet Accounts: A client may appear in multiple rows if they have transactions for themselves and separate transactions for a family member or pet. These are tracked as individual rows to maintain data accuracy.
- For pet businesses, the report will show the word “deceased” in parentheses next to the name of the pet that was marked as deceased
- Expected Lifespan is a company-wide estimate of how many years a typical client stays active with your business. This value is updated automatically on the 5th of every month. To calculate this, the system first determines your Annual Churn Rate (the percentage of customers who visited in year one but did not return in year two). The system then applies the following logic to keep your projections realistic:
- Insufficient Data: In cases where the eligible client count is below 100, the system applies a default expected lifespan value of 3.0 years.
- Perfect Retention: To keep projections practical, the maximum lifespan is capped at 20 years.
- High Turnover: If the churn rate exceeds 200%, the lifespan is capped at 0.5 years.
- New Businesses: If there is insufficient historical data, the system uses a default of 3.0 years.
- Once the system identifies your client counts, it follows a simple two-step process to determine the lifespan:
- Step 1: Determine the Annual Churn Rate
- This measures the percentage of your established customer base that stopped visiting over the last year.
- Annual Churn Rate = Churned Clients ÷ Eligible Clients
- Step 2: Convert Churn into Lifespan
- This translates that percentage into a time-based metric. It answers: "Based on our current loss rate, how many years does the average customer stay?
- Formula Expected: Customer Lifespan = 1 ÷ Annual Churn Rate
- For accounts that use POS, the report is driven by financial records.
- The Unit of Measure: The Closed Ticket. One ticket equals one transaction, regardless of the number of services or products included.
- The Data Source: The system only looks at tickets with a "Closed" status, ensuring that projections are based on actualized revenue.
- Metrics Calculation: Metrics are calculated based on the close ticket date.
- Client History: The "Client Since" date is marked by the day the first ticket was closed.
- For accounts that do not use POS, the report is driven by booking and attendance records.
- The Unit of Measure: The Service Session. Each individual appointment or class session counts as one transaction.
- The Data Source: The system pulls from the client’s booking history. For subscription-based models, value is measured by the volume of sessions the client actually attends.
- Metrics Calculation: Metrics are calculated based on the scheduled date of the appointment or class session.
- Client History: The "Client Since" date is marked by the date of the client's first scheduled session in the system.
- Guardrail for New Clients (Under 6 Months)
- To ensure your business data stays accurate and isn't skewed by small sample sizes, the report applies a restriction for newer clients:
- Projection Columns: For clients with less than 6 months of tenure, the future projection columns—Average Order Value (AOV), Average Visit Frequency (AVF), and LTV—will remain blank.
- Historical Spending: The Total Spend to Date column will continue to display their real, actual spending starting from day one.
- For tickets paid using a membership, package, or gift card, the 'Lifetime Value' and 'Avg Order Value' columns in the report will not display a value.
- In the client search results, the system displays the pet's name in parentheses immediately following the owner's name. This ensures that staff can quickly identify the correct client when multiple owners share the same name. Example :
- Search Query: You search for "John Smith."
- Search Result: The system displays John Smith (Buddy)
Content:
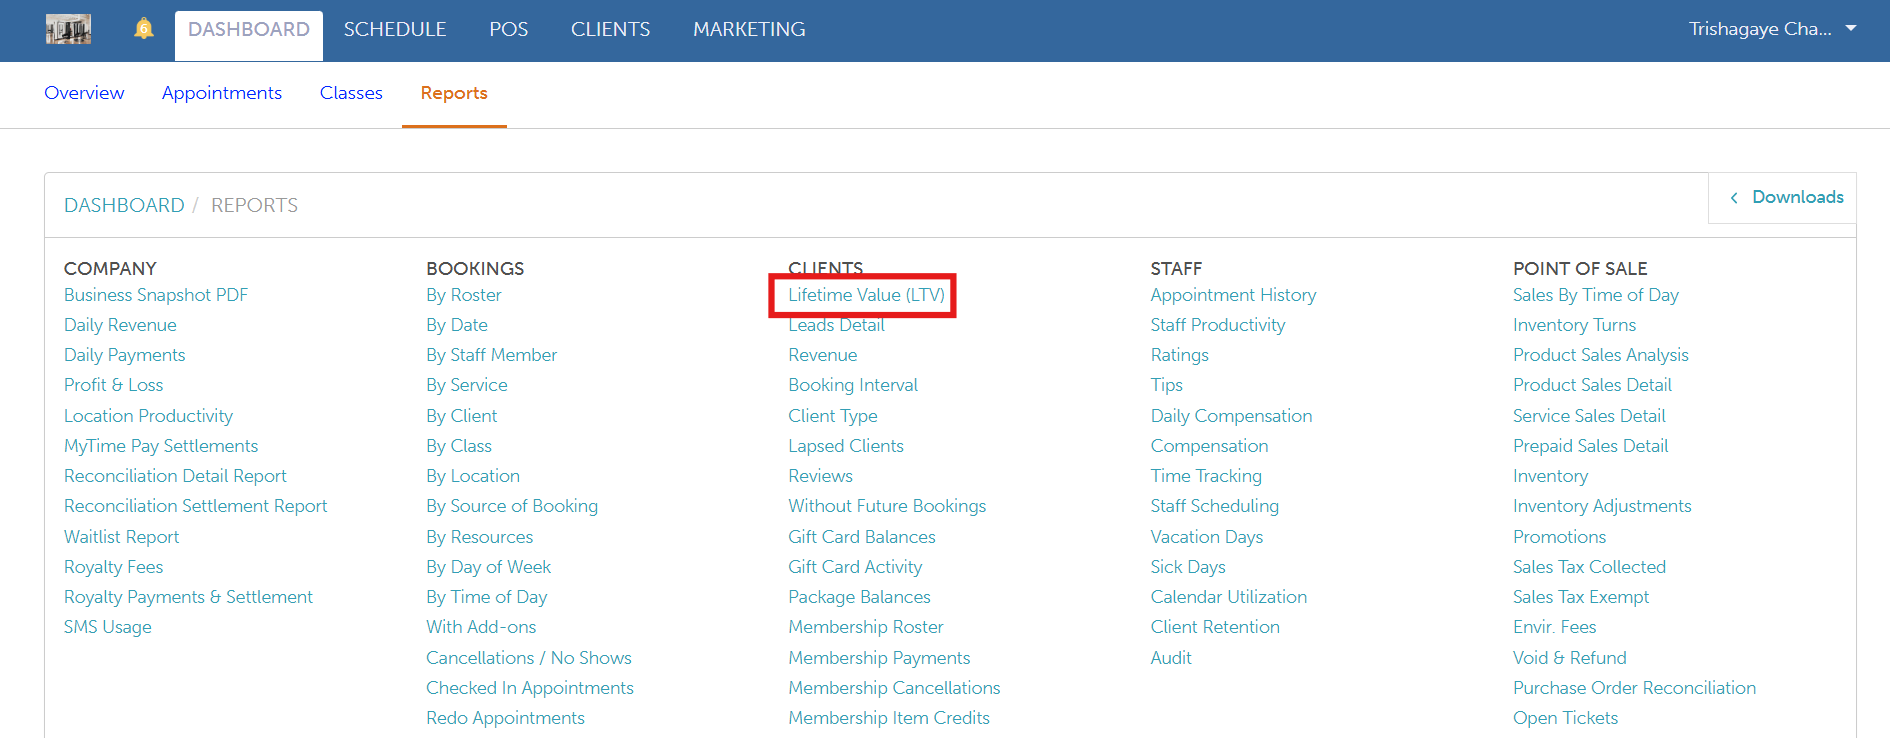
To access this report:
- Navigate to Dashboard
- Select the Reports tab
- Under the Clients section, select the Lifetime Value (LTV) report
When you open the report, you can refine the data using the following filters: Location, Membership Status, Client Source, and Client Since date. After selecting your filters, click the Update button to generate the corresponding results.
Report Filters
| Filter | Description |
| Location | Filter the report by specific business locations. When selected, only clients who have a recorded visit at the chosen location(s) will be included.
|
| Membership Status | This filter is available only for accounts with a Membership subscription and lets you segment clients based on their membership activity.
|
| Client Source | Only available for businesses with client source tracking enabled. This multi-select dropdown lets you filter clients based on how they originally came to your business. Options include any booking source your company has configured (e.g., Online Booking, Walk-In, Staff Entry). Selecting multiple sources will show clients from any of the selected sources. A special "(none)" option is available to include clients who do not have a source recorded. |
| Client Since | Use this filter to analyze clients based on the date of their first transaction, helping you focus on a specific cohort of clients.
Example Use Case:
Please note, the "Client Since" date reflects the first completed transaction, not the date the client profile was created. |
Report Columns
| Column | Description |
| Client | Displays the client’s first and last name. The name is hyperlinked; clicking it will redirect you to the client’s profile. |
| Family Member | Displays the family member's name associated with the client profile as a hyperlink. Clicking the name redirects you to the client profile to view the family member's information. Note: The name only appears if the family member was specifically included on a closed ticket. |
| Pet | Displays the pet's name associated with the client profile as a hyperlink. Clicking the name redirects you to the client profile to view the pet's information. Note: The name only appears if the pet was specifically included on a closed ticket. |
| Lifetime Value | The Lifetime Value represents a forward-looking projection of the total revenue a client is expected to generate over their entire relationship with your business. It is displayed as a monetary value and is calculated using the client’s spending history and your business’s overall retention performance. Formula: Net Revenue to Date + (Average Order Value x Annual Visit Frequency x Expected Lifespan) Example: A client active for 24 months, spent $640 across 8 appointments, company lifespan = 3 years:
Note: Clients active for less than 6 months will display as "< 6 months". |
| Total Spend to Date | This column displays a client's actual, all-time net spending using the following calculation: {Gross Sales} - {Discounts} - {Prepaids} - {Refunds}. Pro Tip: Click the header of this column to quickly sort your list and instantly identify your highest-paying all-time customers. |
| Source of Client | Indicates how the client was originally acquired (e.g., Online Booking, Walk-In, Staff Entry, etc.). This value is recorded when the client profile is created and should match the source displayed in the Clients Revenue Report. |
| Client Since | The date of the client’s first closed ticket with the business. This represents when the client completed their first purchase or attended their first appointment. |
| Avg Order Value | The Average Order Value (AOV) represents the average amount a client spends per transaction. . Formula: AOV = Net Revenue ÷ Number of Tickets Where: Net Revenue = Gross Sales − Prepaids − Discounts − Refunds You can verify this value in the Clients Revenue Report by filtering the report to All Time and dividing the Total Net Revenue by the Number of Tickets. Example:
If the client completed 6 tickets, the calculation would be: AOV = $300 ÷ 6 = $50 In this example, the client’s Average Order Value is $50 per transaction. |
| Annual Visit Frequency | The Annual Visit Frequency (AVF) metric estimates how many times a client visits your business per year, based on their actual historical visit patterns. The system determines AVF by dividing the total transactions by the months since the first visit, then multiplying by 12. Example:
|
| Expected Lifespan (years) | The Expected Lifespan represents the average number of years a customer remains active with the business, derived from the overall Churn Rate. Formula: 1 ÷ Annual Churn Rate Key Details:
Note: The Expected Lifespan is automatically recalculated on the 1st of every month at 2:00 AM UTC. |
Report Footer
Footer | Description |
| Lifetime Value (LTV) | The total projected value of your filtered client base (AOV × Avg Annual Frequency × Company Lifespan ). |
| Average Order Value (AOV) | The total net revenue divided by total transactions across all visible clients. |
| Annual Visit Frequency | The average number of times your visible clients visit per year. |
| Expected Lifespan | A company-wide metric; it is used for calculations but does not appear as a separate footer. |
Glossary
- AOV (Average Order Value): The average revenue generated per transaction.
- Annual Visit Frequency: The estimated number of times a client visits per year, extrapolated from their historical behavior.
- Churned Clients: A subset of "Eligible Clients" who visited during the first half of the 24-month window (months 13–24) but did not return during the most recent 12 months.
- Churn Rate: The percentage of active customers who stop visiting the business within a 12-month period.
- Client Since Date: The specific date of a client’s first completed transaction (ignores cancellations).
- Eligible Clients: The "pool" used to calculate churn. Includes clients whose first visit was at least 12 months ago and who have visited at least once in the last 24 months.
- Expected Lifespan: The average number of years a customer remains active with the business. This is a company-level metric calculated via churn rate.
- LTV (Lifetime Value): The estimated total revenue a client is projected to generate over their entire relationship with the business.
- Net Revenue: Gross sales minus refunds, discounts, and credits (e.g., package or membership credits).
- Transaction:
For accounts with the POS feature: A single closed ticket.
For accounts without the POS feature: A single appointment or class session.
Walk-in Client: A temporary client record without a permanent profile. Note: These clients are excluded from the LTV report.
For more information, contact us at support@mytime.com or (385) 233-6964.
Related Article:
Was this article helpful?
That’s Great!
Thank you for your feedback
Sorry! We couldn't be helpful
Thank you for your feedback
Feedback sent
We appreciate your effort and will try to fix the article