The Leads Conversions Report provides a detailed view of leads that have successfully converted into clients and generated business for your company. It helps you evaluate lead quality by tracking and displaying key performance metrics, including:
- Conversion Timing: Exactly when each lead officially converted into a client
- Visit Frequency: How often the converted clients return for visits or appointments
- Estimated Customer Lifetime: The projected duration of time the client will remain with your business
- Lifetime Value (LTV): The total financial value and revenue generated by the client over their entire relationship with your company
Things to know:
- This report is available only if you have the Lead Management module active and the Accessing Reports permission enabled. To add the Lead Management module to your account, please contact your Account Manager or reach out to our team at support@mytime.com.
- Location-restricted staff can access this report with their assigned locations preselected by default. Unassigned leads are automatically included for these staff members to maintain accurate conversion rate tracking.
- The report includes:
- Leads converted to clients by booking an appointment.
- Leads converted when an appointment is completed, if the hidden setting is enabled.
- Clients who were manually converted, even if they have not booked an appointment.
- To ensure reporting accuracy, converted leads who have no completed tickets are automatically excluded from this report.
- The report is sorted by Creation Date (newest first) by default.
- Revenue displayed includes all item types, such as services, products, memberships, packages, and more
- Sales tax, tips, and voided tickets are excluded from revenue calculations
- The footer automatically displays the exact averages for your clients' yearly visit frequency, lifetime years, and total estimated lifetime value (LTV).
- For franchise businesses with the global client database enabled, you will see client details across all franchise locations.
- To calculate Customer Lifetime (years), the system first determines your Annual Churn Rate—the percentage of customers who visited in their first year but did not return in their second year. It then applies the following rules to ensure the projected customer lifetime remains realistic:
- Insufficient Data: If fewer than 100 eligible clients are available, the system uses a default Customer Lifetime of 3.0 years.
- Perfect Retention: If the calculated Customer Lifetime exceeds 20 years, it is capped at 20 years.
- High Turnover: If the calculated Customer Lifetime is less than 0.5 years (for example, due to a very high churn rate), it is capped at 0.5 years.
- New Businesses: If there is insufficient historical data to calculate an Annual Churn Rate, the system uses a default Customer Lifetime of 3.0 years.
- The Lead Source column shows where the lead originally came from. This value is taken directly from the lead profile at the moment it is converted. It does not change based on how the client was created during conversion. Example: A lead was originally created with the source “Added by Staff.” Later, that lead is converted into a client through Online Booking – Express Checkout.
- In the report:
- The Lead Source column will still show “Added by Staff,” because that is how the lead was first captured.
- On the newly created client profile:
- You will see the original Lead Source (e.g., Added by Staff)
- And you will also see the Client Source (e.g., Online Booking – Express Checkout). This helps show both where the lead came from originally and how the client was created at the time of conversion.
- The report can only be exported in Summary View, which consolidates data by category such as location, staff member, or service type. This view is ideal for high-level analysis, allowing you to review total revenue and overall performance metrics without displaying individual transactions.
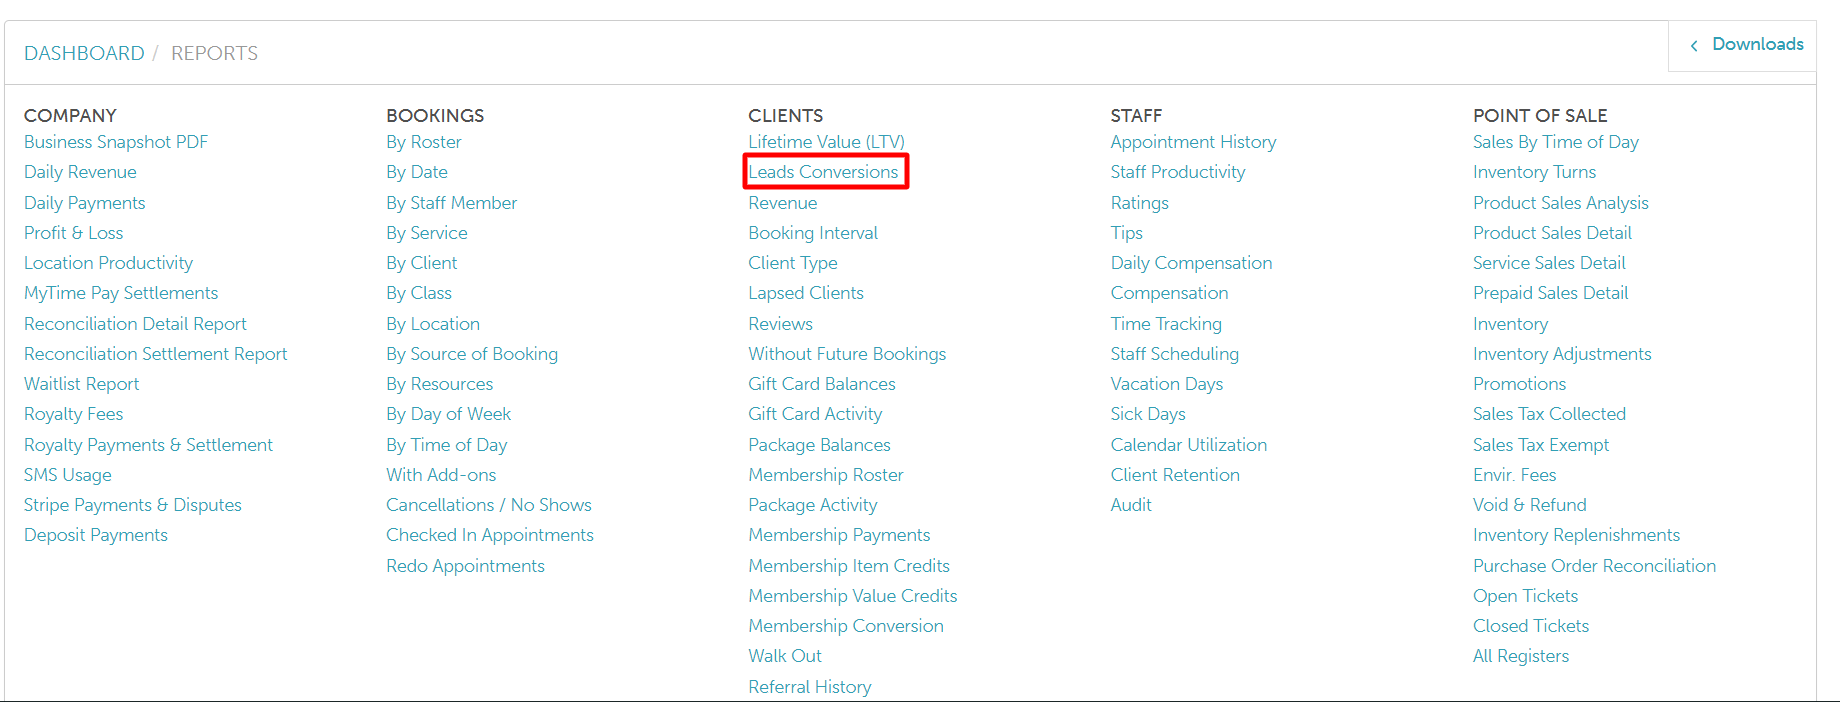
To access this report:
- Navigate to Dashboard
- Select the Reports tab
- Under the Clients section, select the Leads Conversions report
- When the report opens, you can filter the data by the lead creation date. After selecting your desired date range, click the 'Update' button to generate the corresponding data.
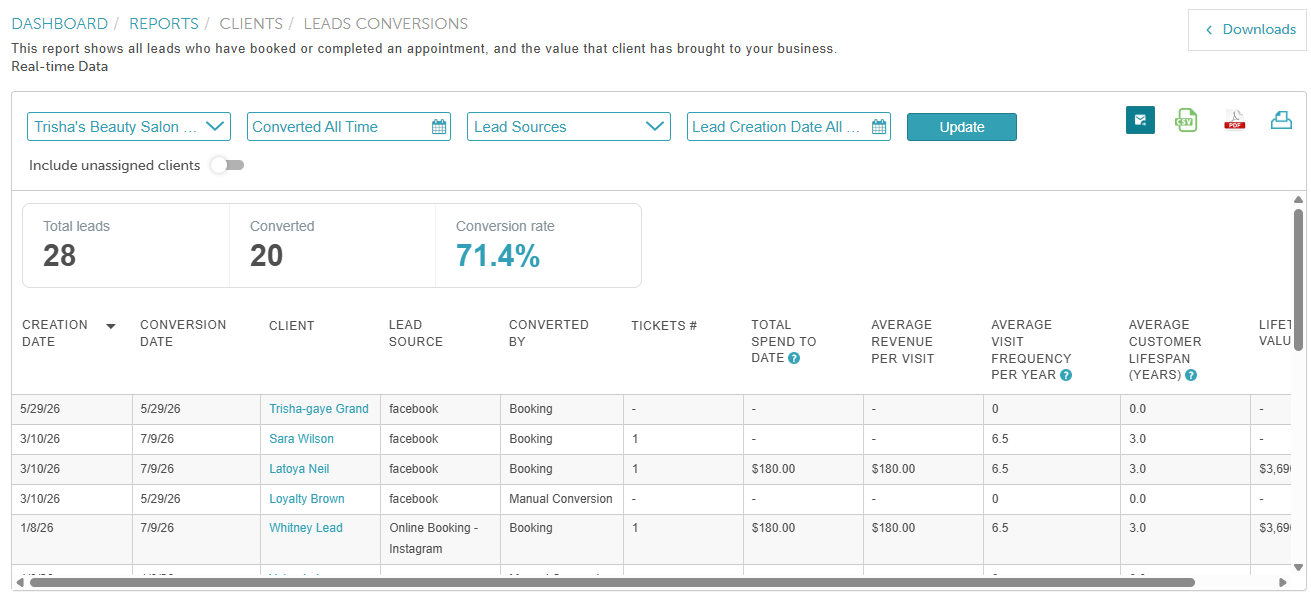
The Metrics Strip
The Metrics Strip displays three key summary metrics that update automatically whenever you adjust your filters:
| Metric | Description |
| Total Leads | The total number of leads matching your selected Location and Lead Source filters, including both converted and unconverted leads. Note: This count intentionally ignores the Converted Date filter so unconverted leads are not excluded and the total lead count is not skewed. |
| Converted | The number of converted leads currently displayed in the report table. This count will always match the total row count of the table. |
| Conversion Rate | The percentage of total leads that successfully converted, calculated as: Converted Leads / Total Leads. |
Report Filters
| Filter | Description |
| Location | Filter the report by the converted lead's associated location.
|
| Include Unassigned Clients Toggle | Appears when a specific location is selected. When enabled, converted leads without an assigned location are included in the report calculation. |
| Converted Date | Filters leads based on the date they were converted to clients |
| Lead Source | Filters leads by the source from which they were acquired |
| Lead Creation Date | Filters leads based on the date the lead record was originally created in the system. |
Report Columns
| Column | Description |
| Creation Date | The date when the lead was first created |
| Conversion Date | The date when the lead was converted into a client |
| Client | The name of the client |
| Lead Source | The source from which the lead was acquired |
| Converted By | Indicates whether the conversion was done manually or through a booking |
| Tickets # | Total number of closed tickets associated with the client |
| Average Revenue Per Visit | Average Visit Frequency per Year estimates how often a client visits your business each year based on their completed ticket history. The calculation varies depending on how long the client has been with your business. New Clients (Less than 30 days) Formula: Visits × (365 ÷ 30) Example: A client has completed 2 visits within their first 15 days. 2 × (365 ÷ 30) = 24.3 visits per year Existing Clients (30 days to less than 1 year) Formula: Visits × (365 ÷ Days as Client) Example: A client has completed 8 visits over 120 days. 8 × (365 ÷ 120) = 24.3 visits per year Established Clients (1 year or more) Formula: Total Visits ÷ (Years as Client) Example: A client has completed 45 visits over 2 years and 3 months. 45 ÷ (2 + 3 ÷ 12) = 20.0 visits per year Note: The value is displayed to one decimal place. This rounded value is also used when calculating Lifetime Value. |
| Average Visit Frequency per Year | The average number of visits per year, based on closed ticket history. The calculation is different based on the client's tenure.New Clients (Tenure less than 30 days)Calculation: Visits × (365 ÷ 30) Existing Clients (Tenure less than or equal to 30 days to 1 year)Calculation: Visits × (365 ÷ Days as Client) Established Clients (Tenure greater than or equal to 1 year)Calculation: Total Visits ÷ (Years + Months ÷ 12)Example: If the client had 45 visits in 2 years and 3 months, the calculation would be 45 ÷ (2 + 3 ÷ 12) = 20 |
| Average Customer Lifespan (Years) | Customer Lifetime (years) represents the average number of years a customer is expected to remain active with your business. This company-wide value is derived from your business's annual churn rate and is used to estimate Lifetime Value for every converted lead in the report. Formula Customer Lifetime = 1 ÷ Annual Churn Rate Key Details
|
| Lifetime Value | Lifetime Value (LTV) The Lifetime Value (LTV) estimates the total value a client is expected to generate over their lifetime. Formula Lifetime Value = Total Spend to Date + (Average Revenue Per Visit × Average Visit Frequency per Year × Customer Lifetime). Example: A client has the following profile: Total Spend to Date: $480 Average Revenue Per Visit (ARPV): $40 Average Visit Frequency per Year (AVF): 12.0 Customer Lifetime (years): 3 LTV = $480 + ($40 × 12.0 × 3) LTV = $480 + $1,440 LTV = $1,920 |
For more information, contact us at support@mytime.com or (385) 233-6964.
Related Articles:
- Converting Leads to Clients
- Adding Leads Manually
- Importing Leads
- Exporting Leads
- Configure Lead Notifications
- Lead Intake Forms
- Leads Widget Configuration
Was this article helpful?
That’s Great!
Thank you for your feedback
Sorry! We couldn't be helpful
Thank you for your feedback
Feedback sent
We appreciate your effort and will try to fix the article